Part of my job as a graduate student instructor this term is to answer questions on our class Piazza site. I though I might post some of the answers here as well (since the Piazza is private and will probably be lost to the ether after the semester ends).
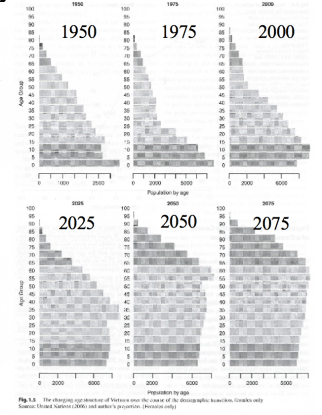
Lecture slide: Viet Nam’s age structure during the demographic transition.
Student question (paraphrased): In lecture, we were asked “Is Viet Nam’s fertility sub-replacement in 2000?” I don’t know how to answer this.
I explained that we can’t tell from the shape of this non-stable age pyramid whether fertility is sub-replacement, only that it’s falling (since the 0-5 cohort is smaller than the 5-10 cohort). The student then clarified that their problem was with the term sub-replacement fertility.
My response:
Oh, okay, sorry for misunderstanding! First we need to understand what a stable population is. A stable population is a population where the proportion of people in each age group stays constant over time, because rates of fertility and mortality in each age group are constant. A stable population can be growing, shrinking, or staying the same size, but whatever it’s doing, it’s doing it at a stable, constant rate. (Stable populations are mathematical ideals, but there are populations in the real world that are close to stability.)
Replacement fertility is the level of fertility needed in a stable population to keep population growth at zero, so the population stays the same size. Above-replacement fertility leads to population growth; sub-replacement fertility leads to population decline.
Numerically, replacement fertility is a total fertility rate (TFR) of 2.1 children per woman. (In populations with lower life expectancy, replacement fertility is higher, because more infants die before they can grow up to have their own children. But 2.1 is the right number to memorize.)
Graphically, a stable age pyramid with replacement fertility and moderate to high life expectancy will tend not to flare out too much at the base, but it also won’t go in. However, the age pyramid for Viet Nam in 2000 is not a stable age pyramid, but an age pyramid for a population that is undergoing changing rates: we can see that women in 2000 are having fewer children than they were a few years ago, because there are more 5-to-10-year-olds than 0-to-5-year-olds. However, we don’t have any information about what the actual level of childbearing is.
It isn’t too important to grasp all the nuances here, but you should know 1) what a stable population is, 2) what the concept of replacement fertility means, and 3) the number 2.1, the TFR for replacement fertility in most contemporary populations. I also encourage you to play around with this app that Prof. Goldstein built, to understand what combinations of life expectancy and fertility lead to positive, negative, and zero (replacement) growth, and what those combinations look like.
